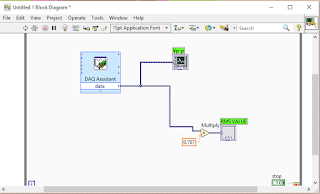
Firstly, i connect the DAQ to the computer. Then, i open NI MyDAQ to verify the validity of the signal provided by the DAQ. NI MyDAQ is use as the test run before the actual measuring begin. After the data of the test run has been verified, i continued the exercise using the actual LabVIEW program.
Second, i connect the DAQ to the analog trainer's function generator output port. For the information, u can use another port like ai1, ai2, ai3 and many more. In my case, the port that i used was ai2 port. Then, i proceed to construct the broad simulation onto the block diagram, starting with DAQ Assist, While Line, the waveform graph and then lastly, the multiplier for the last task.
My DAQ Assist was set to -10 to 10 V min and max reading, NRE terminal configuration and continuous mode. the samples taken were 1kHz out of 1kHz.
First task : triangle waves with 3vp-p ( 3vp-p = 1.5vp)
Second task : square waves with 1.5Vamp
Third task : sinusoidal waves with 2.55Vrms (3.6Vp-p = 2.55Vrms) Vp-p / √2
Block diagram
As conclusion, this exercise shows the function of each equipment given and familiarize the student with the step by step of using the LabVIEW.


No comments:
Post a Comment